The Class/Event Revenue Summary report displays all revenue based on filters (Search Criteria) you select that is associated with a Class/Event such as Tuition Fees, Costume Fees, Competition Fees, Taxes, etc.
Get to this report from the Transactions menu> Transaction Reports > Class/Event Revenue Summary.
- View average revenue per student.
- Determine which classes were most profitable and which ones had a lower average revenue.
- Format the report to show one line per Category 1 (Cat1) per class/event, or as a summary with one line per class/event.
Search Criteria
Use the Search Criteria to narrow the report results:
- If you have multiple locations in Jackrabbit, you have the option to look at revenue based on the location on the family's record and/or the location where the class or event is held using the Class/Event Location criteria.
- Look at class/event revenue for a specific Class Session, selected Category 1, or use Select Class to review revenue for a particular class.
- Review payments received on a single date or for a range of dates. The date criteria are required fields.
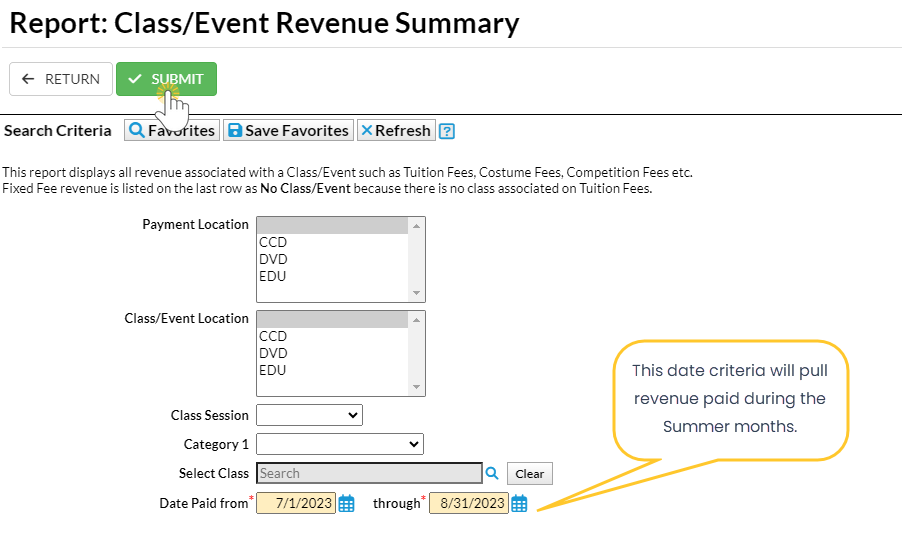

Leaving a criteria selection blank is the same as saying "all".
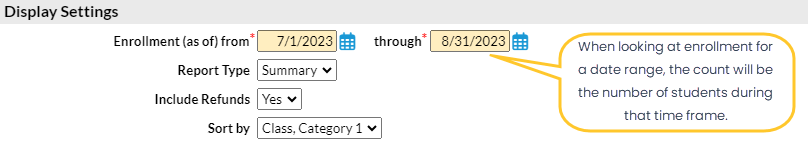
Display Settings
Use the Display Settings to format your report:
- Calculate the enrollment as of a specific date or over a range of dates where the count is the highest number of students that were enrolled during that time. The enrollment criteria are required fields.
- Choose whether you want to see a separate line for revenue by Category 1 for each class/event (Detail) or you prefer to see only one line for all revenue in the class/event (Summary).
- You can opt to include any refunds issued for payments related to class/event fees or omit them.
- Sort the report either by Class, then Category 1, or by Category 1, then by Class.

Report Results
The report results can be further customized with the ability to show or hide columns of information, sort columns, or modify column width. Note: Depending on the width of the report, reduce the size/scale of the report so all the columns print.
- The Avg Revenue Per Student is calculated as the revenue for the date range chosen divided by the enrollment for the selected time frame. Revenue displayed per student does not include discounts.
- Use the Class/Event link to quickly navigate to the class or event record.
- Click Adjust columns > Squeeze grid
 to view the entire grid on the page.
 - Click the Refresh Grid (icon)
 to update results in the grid.
 - Click the More (icon)
 to print or export the data to Excel.
 to view the entire grid on the page.
 to update results in the grid.
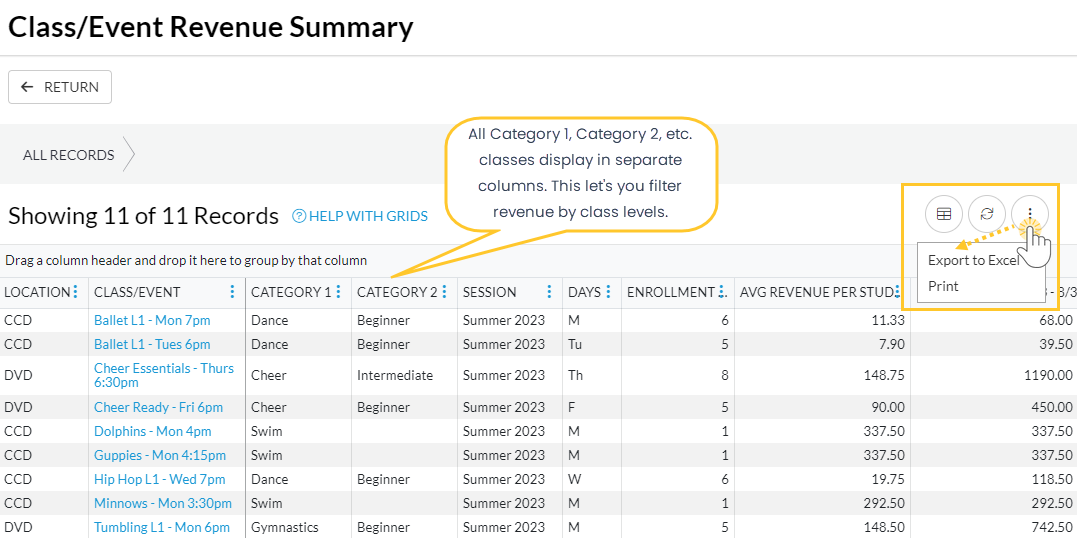
Jackrabbit grids are very powerful and allow you to customize your layout, search, and filter your results. Refer to Work with Grids in Jackrabbit for more details on how easy and flexible these grids are to work with.