The Key Metrics widget on the Executive Dashboard offers a quick view of enrollment and registration information. Each metric links to a detailed report.
- Identify areas that need attention at a glance.
- Get instant insights into enrollment and registration trends.
- Make informed decisions with detailed linked reports.
Customize Your Key Metrics Widget
To customize Key Metrics, click the Dashboard Settings button at the top of the Executive Dashboard.

The Dashboard Settings have three sections related to the Key Metrics: Enrollments, Drops, and Registrations.
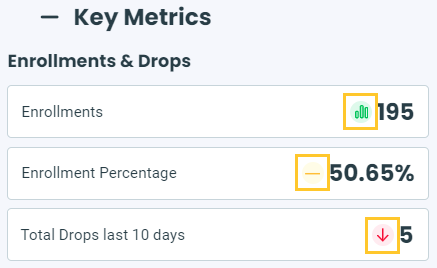
Enrollments & Drops
Each of the Enrollment Total, Enrollment Percentage, and Total Drops in the last X days metrics are accompanied by an icon that provides a visual indication of the degree of attention required. The icons are controlled by your defined thresholds, i.e., your tolerance levels.
The icon colors are the same as traffic lights, making the meanings easy to understand and remember:
- Green means the metric is meeting your goal.
- Yellow is a warning that the metric value is outside the desired range.
- Red means the metric has reached a problem level and needs attention.
Use the Green and Yellow fields to define your thresholds. The icons will change to red based on their relationship to the yellow number (< less than or > greater than).
Use the Total Drops in Last X days field to define the number of days included in the Total Drops in Last X days Key Metric.
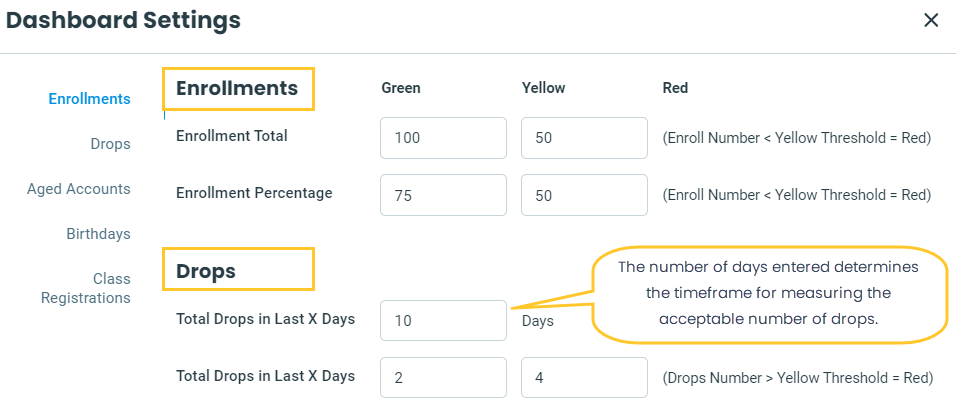
For Enrollment Total and Enrollment Percentage:
- A green icon displays if the value is equal to or above the green threshold.
- A yellow icon displays if the value is equal to or above the yellow threshold but below the green threshold.
- A red icon displays if the value is below the yellow threshold.
For Total Drops in Last X days:
- A green icon displays if the value is equal to or below the green threshold.
- A yellow icon displays if the value is above the green threshold but below the yellow threshold.
- A red icon displays if the value is equal to or above the yellow threshold.
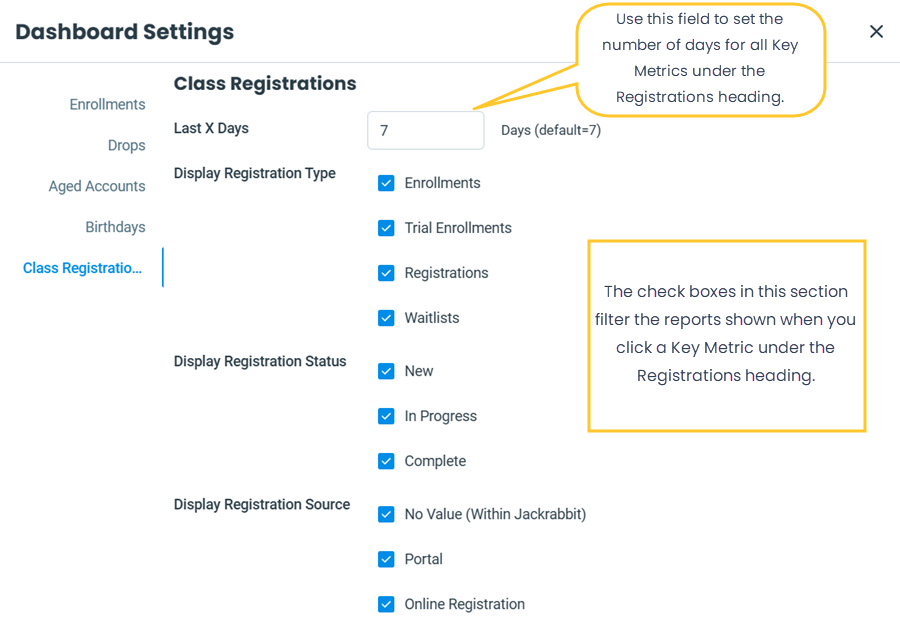
Registrations
Use the Last X Days field to define the number of days to include in the Portal Enrollments last X days, Online Registrations, and Class Registrations to be Processed Key Metrics.
Use the Display Registration Type, Display Registration Status, and Display Registration Source checkboxes to choose what registration types, statuses, and sources should be included in the Portal Enrollments last X days, Online Registrations, and Class Registrations to be Processed Key Metrics.
Widget Wisdom - Understand and Interact
The Key Metric widget offers various interactive components. Some provide a deeper dive into your data, while others enable customization of your Executive Dashboard display.
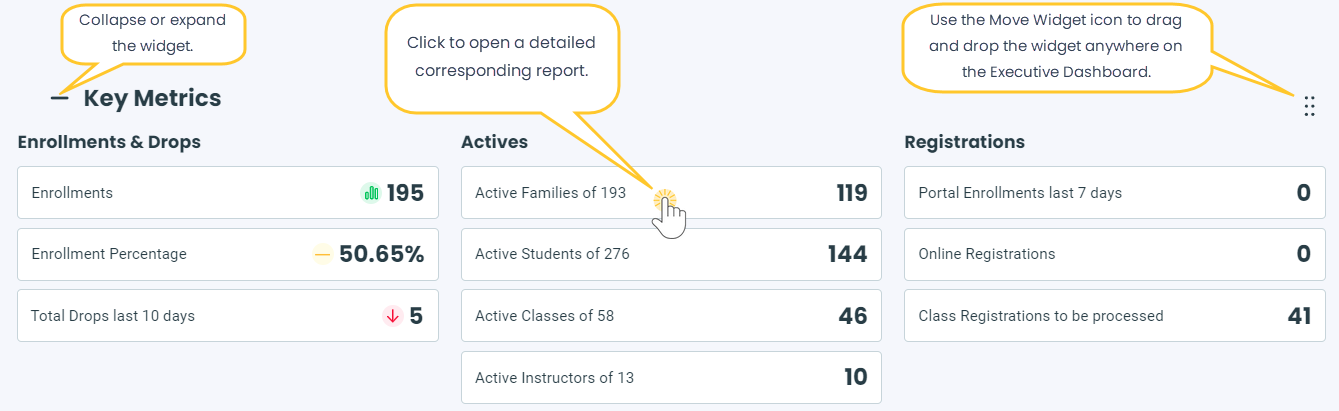
- Click on any metric to open the corresponding report; for example, click on Active Families of ## to open the List Active Families report or select the Class Registrations to be processed metric to open the Process Class Registrations report.
The choices you make in the Dashboard Settings filter the reports you access through the Executive Dashboard. For example, if you set the Total Drops in the Last X days to 10, clicking on the Total Drops last 10 days metric will show a report reflecting drops from the last 10 days.
- Hover over the Enrollments metric to reveal two links:
- View Enrollments opens the Enrollment Snapshot 1 report.
- View Category 1 Chart opens a chart showing Category 1 enrollments.
- Collapse or expand the widget using the
 or
or  next to Key Metrics.
 - Use the Move Widget icon to drag and drop the widget anywhere on your Executive Dashboard to customize your view. Your chosen layout will be retained each time you visit.

 or
or  next to Key Metrics.