The Executive Dashboard empowers you with key metrics, data visualizations, alerts, and more. Dive deeper with quick and easy access to related reports.
- Understand your data with visualizations that provide a clear picture of trends and patterns.
- Track performance at a glance with key metrics that update in real-time.
- Stay ahead of the game with alerts that call out items that need your attention.
- Customize your Executive Dashboard layout to focus on what matters most to you.
Use the links below to learn about each of the widgets on the Executive Dashboard.
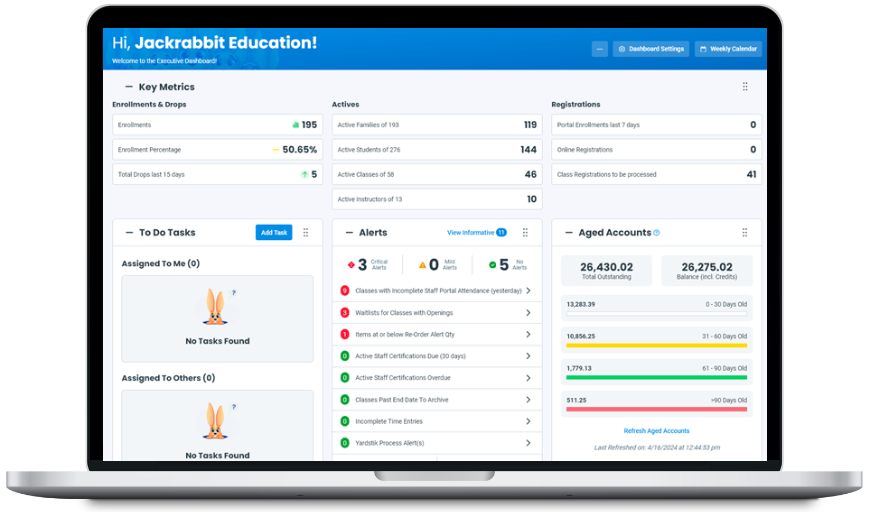
| Key Metrics
|
At a glance information on enrollment and drops, active records (Family, Student, Class, Instructor), and registrations with quick access to related reports. |
| To Do Tasks
|
Assign tasks to yourself and your staff and monitor their progress. |
| Alerts
|
View actionable and informative alerts and use quick links to access important information, including upcoming birthdays, waitlists with openings, overdue staff certifications, and more. |
| Aged Accounts
|
Aged accounts are broken into time buckets that can be color-coded to alert you to the family accounts that need attention. |
| Revenue Summary
|
Bar charts represent your revenue with two options: the current year compared to two previous years or 12-month trailing revenue. |
| Internal Announcements
|
Keep your Jackrabbit Users in the loop at a glance. |